


Mean, median, and mode are three ways to describe the typical value in a data set. A data set is a collection of numbers, such as test scores, heights, or the number of books each student read.
- Our Practice Data Set
- How to Find the Mean (and How to Find the Average)
- How to Find the Median
- How to Find the Mode
- Comparing the Results
- Adding the Range: Mean, Median, Mode, and Range
- When to Use Mean or Median (and Mode)
- Edge Cases You Will Meet on Tests
- Common Mistakes to Avoid
- Practice Problems (With Answers)
- Conclusion
- Mean: Add all the values, then divide by how many values there are. Think of it as a “fair share.”
- Median: Put the values in order from smallest to largest, then pick the middle one.
- Mode: The value that appears most often.
All three are kinds of average. In everyday speech, “average” usually means the mean, but the median and the mode are averages too. That is why the word can feel confusing. When a question says “average,” check which measure it wants.
Memory trick: The mode is the most common. The median sits in the middle, like the median strip on a road. The mean takes the most work: add, then divide.
Our Practice Data Set
We will use the same five numbers in every method, so you can compare the results.
Five students were asked how many books they read last month:
7, 3, 5, 10, 5

How to Find the Mean (and How to Find the Average)
The mean answers this question: “If everyone had the same amount, how much would each person have?”
Mean = sum of all values ÷ number of values
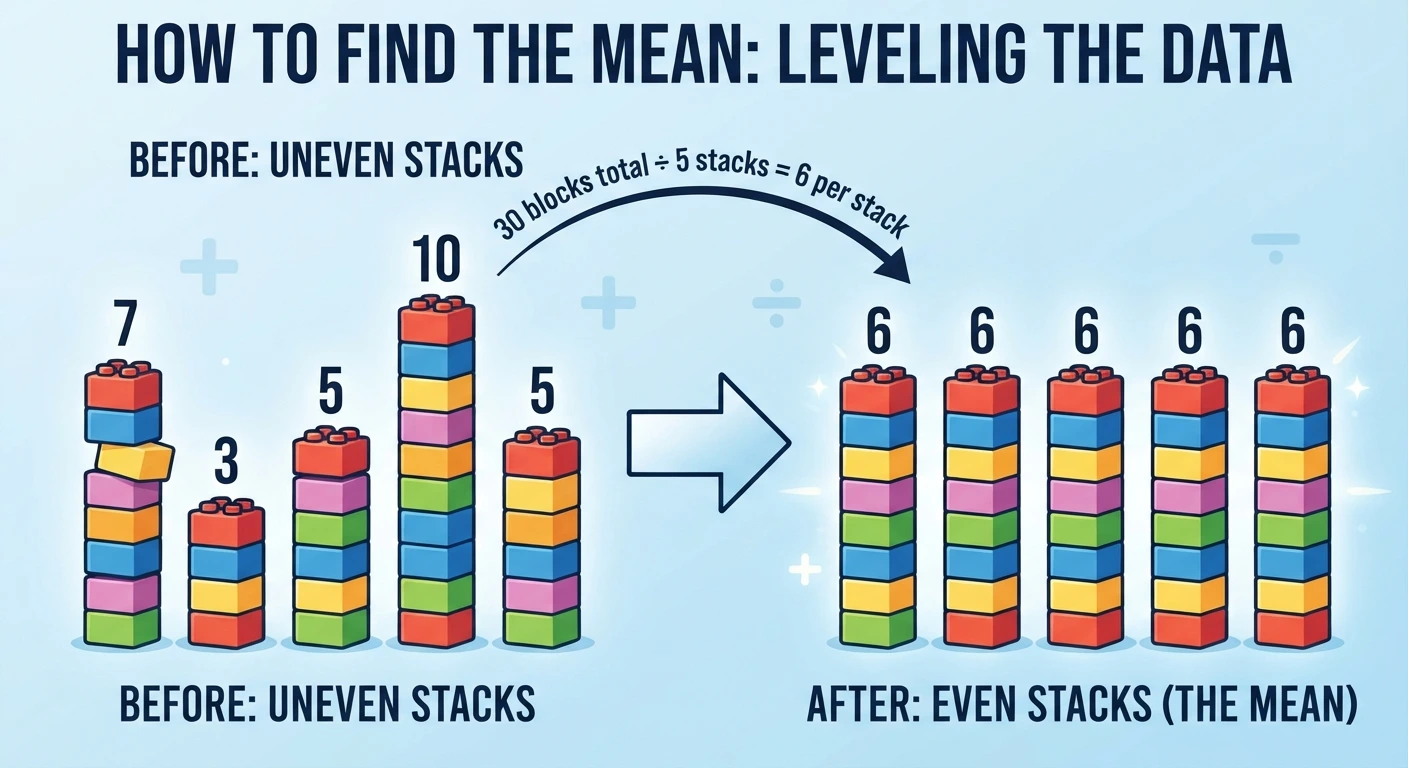
- Add all the values. 7 + 3 + 5 + 10 + 5 = 30
- Count the values. There are 5.
- Divide the sum by the count. 30 ÷ 5 = 6
The mean is 6 books.
If a question just says “find the average” and nothing else, it almost always wants the mean. If the division feels slow, see our long division guide or practice dividing decimals, because a mean is often not a whole number.
How to Find the Median
The median is the middle value once the data is in order. Sorting comes first, and it is the step students skip most often. (Need a refresher on putting numbers in order? See ascending and descending order.)
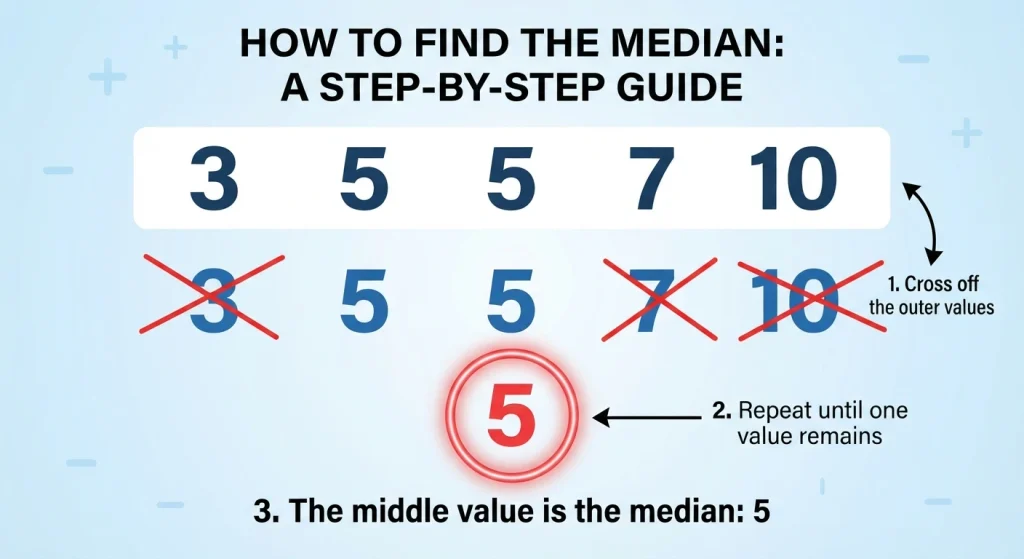
- Sort from smallest to largest. 3, 5, 5, 7, 10
- Count the values. There are 5.
- Find the middle position. With 5 values, the middle is the 3rd.
- Read that value. The 3rd value is 5.
The median is 5 books.
A quick check: cross off one number from each end, again and again. 3 and 10 go first, then 5 and 7, and the last number left is 5.
How to Find the Mode
The mode is the value that appears most often. The number of times a value appears is called its frequency.
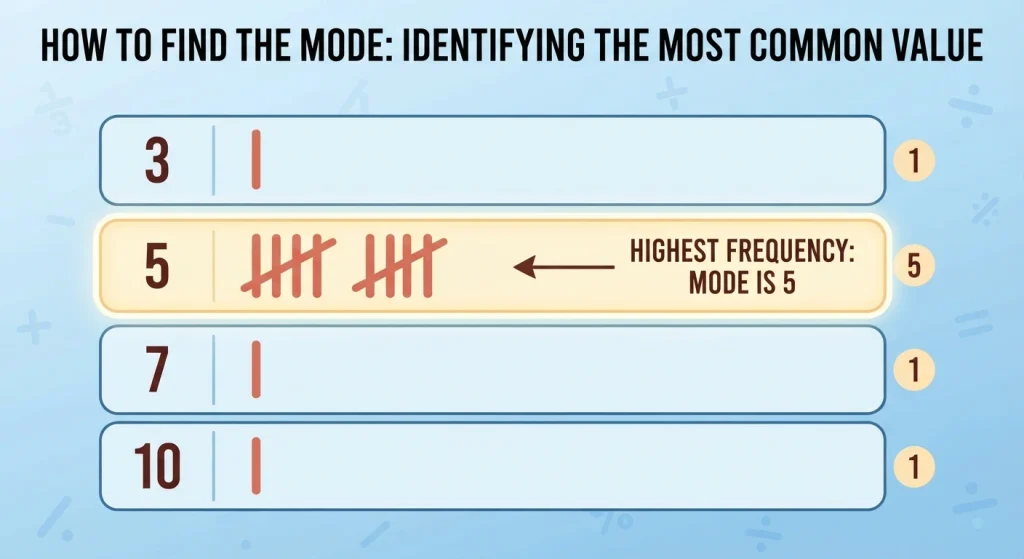
- Write the values in order, so repeats sit side by side: 3, 5, 5, 7, 10
- Count the frequency of each value. 3 appears once, 5 appears twice, 7 appears once, 10 appears once.
- Pick the value with the highest frequency. That is 5.
The mode is 5 books.
The mode is the value (5), not the frequency (2).
Comparing the Results
| Measure | Result for 7, 3, 5, 10, 5 |
|---|---|
| Mean | 6 |
| Median | 5 |
| Mode | 5 |
The three answers are close but not identical. Each describes “typical” in a different way, so the choice matters.
Adding the Range: Mean, Median, Mode, and Range
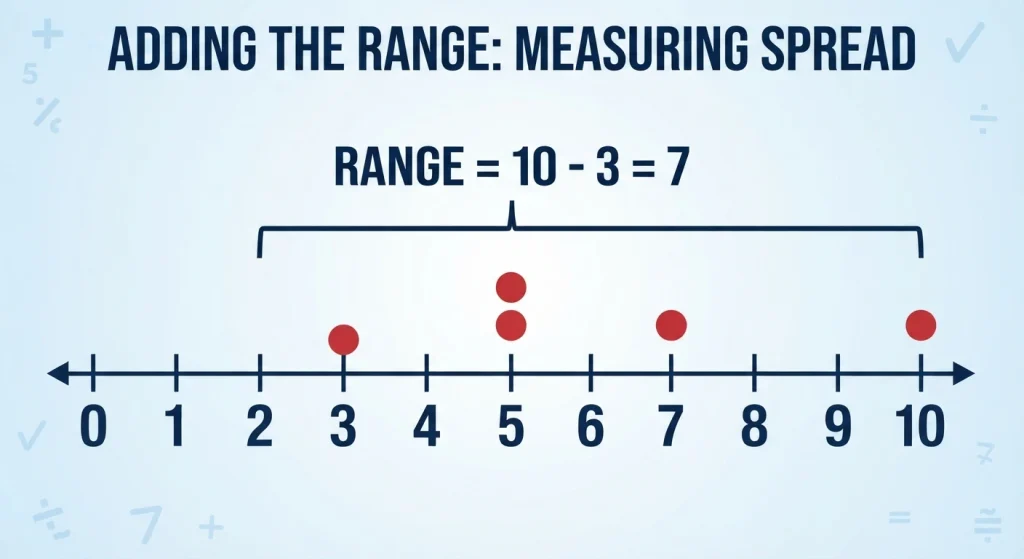
Many questions ask for “mean, median, mode, and range.” The range shows how spread out the data is. Subtract the smallest value from the largest: 10 − 3 = 7.
The mean, median, and mode describe the center. The range describes the spread. For a full walkthrough, see how to find the range.
When to Use Mean or Median (and Mode)
Ask yourself two quick questions:
- Is there a value far away from the rest? If yes, lean toward the median.
- Do I want the most popular choice? If yes, use the mode.
| If the data is… | Best choice | Example |
|---|---|---|
| Fairly even, no extreme values | Mean | Your average score across tests |
| Has one or two extreme values | Median | House prices, or what friends saved |
| About popularity or “most common” | Mode | The shoe size a shop should stock most |
The mode also works for things that are not numbers, such as a class’s favorite fruit. The mean and median cannot do that.
Outliers and the Mean: One Number Changes Everything
An outlier is a value that is much larger or much smaller than the rest of the data. Watch what one outlier does to our book data.
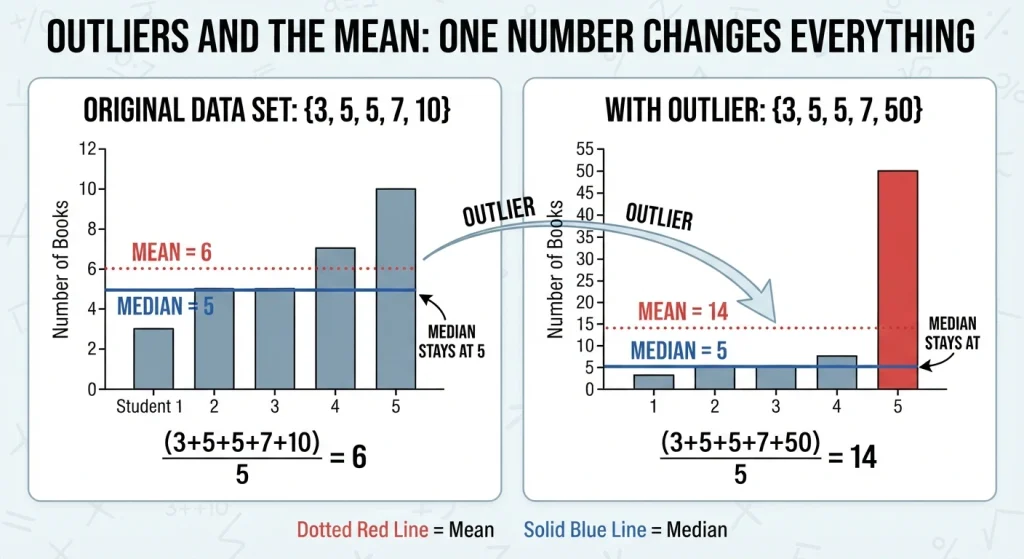
Suppose the student who read 10 books actually read 50.
| Original: 3, 5, 5, 7, 10 | With outlier: 3, 5, 5, 7, 50 | |
|---|---|---|
| Mean | 30 ÷ 5 = 6 | 70 ÷ 5 = 14 |
| Median | 5 | 5 |
| Mode | 5 | 5 |
One extreme value pushed the mean from 6 to 14, more than double. The median and the mode did not move at all.
Now imagine saying “the average student read 14 books.” Four of the five students read 7 or fewer. The mean gives a misleading picture, and the median (5) is a much more honest description of a typical student.
Rule of thumb: With an outlier, the median is usually the better choice. With evenly spread data, the mean works well. To see how these ideas appear outside school, read about averages in everyday math.
Edge Cases You Will Meet on Tests
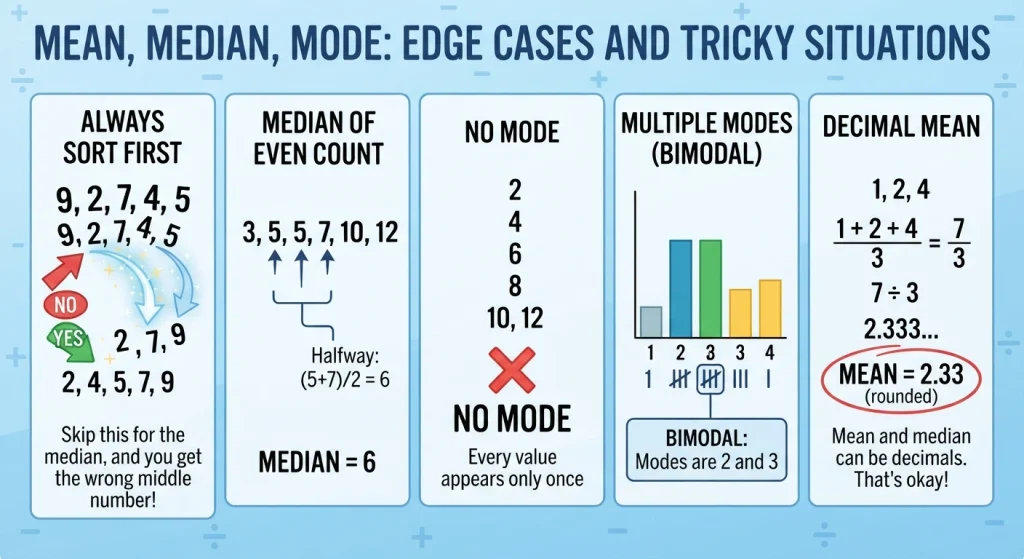
1. Always sort first (for the median)
If you pick the middle of an unsorted list, you will usually get the wrong answer. The mean does not need sorting. The mode is easier after sorting. The median demands it.
2. The median of an even number of values
With an even number of values, there is no single middle number. There are two. The median is the value halfway between them.
Add a sixth student who read 12 books: 3, 5, 5, 7, 10, 12
- The list is already sorted.
- The two middle values are 5 and 7.
- Add them and divide by 2: (5 + 7) ÷ 2 = 6
The median is 6. It is not one of the numbers in the list, and that is fine.
3. Data with no mode
Look at 2, 4, 6, 8. Every value appears once, so no value wins. This data set has no mode. Do not write 0. Write “no mode.”
4. Data with more than one mode
Look at 1, 2, 2, 3, 3, 4. Both 2 and 3 appear twice, and nothing appears more often. There are two modes: 2 and 3. A data set with two modes is called bimodal. If three or more values tie, list all of them.
5. Answers that are not whole numbers
The mean and the median can be decimals. For example, the mean of 1, 2, 4 is 7 ÷ 3, which is about 2.33. That is a correct answer.
Common Mistakes to Avoid
Mistake 1: Not ordering the values before finding the median.
Take 4, 9, 2, 7, 3. The middle number as written is 2, which is wrong. Sort first: 2, 3, 4, 7, 9. The median is 4.
Mistake 2: Dividing by the wrong count.
For 3, 5, 5, 7, 10, some students divide 30 by 4 because they count the repeated 5 only once. Divide by the number of values, repeats included. There are 5, so the mean is 30 ÷ 5 = 6.
Mistake 3: Confusing the mode with its frequency.
In 3, 5, 5, 7, 10, the value 5 appears twice. The mode is 5, not 2.
Mistake 4: Forgetting to average the two middle values.
With an even number of values, the median is halfway between the two middle numbers, not just one of them.
Mistake 5: Mixing up the three words.
If a question asks for the median and you give the mean, you lose the mark even if your arithmetic is perfect. Underline the word in the question before you start.
Practice Problems (With Answers)
Try each problem before you read the answer. For more sets, visit our mean, median, mode worksheets.
Level 1: Warm-up
Problem 1. Find the mean, median, and mode of: 2, 4, 4, 6, 9
Answer:
- Mean: (2 + 4 + 4 + 6 + 9) ÷ 5 = 25 ÷ 5 = 5
- Median: the list is sorted, and the 3rd value is 4
- Mode: 4 appears twice, so the mode is 4
Level 2: Sorting and range
Problem 2. Find the mean, median, mode, and range of: 12, 7, 5, 13, 7, 10, 9
Answer:
- Sorted: 5, 7, 7, 9, 10, 12, 13
- Mean: 63 ÷ 7 = 9
- Median: the 4th of 7 values is 9
- Mode: 7 appears twice, so the mode is 7
- Range: 13 − 5 = 8
Level 3: Even number of values, no mode
Problem 3. Find the mean, median, and mode of: 10, 4, 8, 6, 12, 14
Answer:
- Sorted: 4, 6, 8, 10, 12, 14
- Mean: 54 ÷ 6 = 9
- Median: the middle values are 8 and 10, so (8 + 10) ÷ 2 = 9
- Mode: every value appears once, so there is no mode
Level 4: More than one mode
Problem 4. Find the mean, median, and mode of: 5, 9, 3, 1, 8, 3, 6, 5
Answer:
- Sorted: 1, 3, 3, 5, 5, 6, 8, 9
- Mean: 40 ÷ 8 = 5
- Median: the middle values are 5 and 5, so (5 + 5) ÷ 2 = 5
- Mode: 3 and 5 each appear twice, so there are two modes: 3 and 5
Level 5: Mean, Median, Mode Word Problem (choosing the mode)
Problem 5. A shoe shop sold these sizes in one day: 6, 7, 7, 8, 7, 6, 9, 7, 8. Which size should the shop order the most of next week, and which measure did you use?
Answer:
- Sorted: 6, 6, 7, 7, 7, 7, 8, 8, 9
- Size 7 appears 4 times, more than any other size.
- The shop should order the most of size 7. You used the mode, because the shop cares about the most common size.
Level 6: Word problem with an outlier
Problem 6. Five friends saved this much last month, in dollars: 20, 25, 22, 25, 108.
a) Find the mean, median, and mode.
b) Which value is the outlier?
c) Which measure best describes a typical friend?
Answer:
- Sorted: 20, 22, 25, 25, 108
- a) Mean: 200 ÷ 5 = 40. Median: 25. Mode: 25.
- b) The outlier is 108, because it is far larger than the others.
- c) The median (25) is best. The mean of 40 is higher than what four of the five friends saved, because the outlier pulls it up.
Level 7: Challenge
Problem 7. Mia scored 72, 85, 78, and 90 on her first four tests. She wants a mean of 82 across five tests. What must she score on the fifth test?
Answer:
- For a mean of 82 over 5 tests, the total must be 82 × 5 = 410.
- Her current total is 72 + 85 + 78 + 90 = 325.
- She needs 410 − 325 = 85 on the fifth test.
Stuck on turning a story into numbers? Try our guides to solving math word problems and word problem keywords. Preparing for an exam? See how to study for a math test. For harder reasoning, try some math olympiad questions.
Make Preparing for Math Olympiad Simple!


What is the difference between mean and average?
“Average” is a general word for a typical value, and there is more than one kind. The mean, median, and mode are all averages. In everyday speech, people usually mean the mean when they say “average,” so check which one a question wants.
Which is better, mean or median?
Neither is always better. Use the mean when values are fairly even and you want a fair share. Use the median when the data has outliers, because extreme values do not pull it around.
What if there are two modes?
List both. A data set with two modes is called bimodal. If three or more values tie for most frequent, list all of them.
Can a data set have no mode?
Yes. If every value appears only once, there is no mode. Write “no mode” instead of 0.
How do you find the median with an even number of values?
Sort the data, find the two middle numbers, add them, and divide by 2. The result may not be in the original list, and that is fine.
Do I need to sort the data to find the mean?
No. Adding is not affected by order. Sorting is required for the median and helpful for the mode.
Can the mean, median, and mode all be the same?
Yes. This often happens when data is balanced around the center, such as 2, 4, 6, 6, 6, 8, 10.
What is an outlier, and why does it matter?
An outlier is a value much larger or smaller than the rest. It matters because it can pull the mean up or down a lot, while the median and mode stay steady.
Can the mean be a decimal?
Yes. The mean and the median do not have to be whole numbers. For example, the mean of 1, 2, 4 is about 2.33.
Conclusion
Mean, median, and mode all describe the typical value in a data set, but each answers a different question. The mean is the fair share, the median is the middle value, and the mode is the most common one. Sort your data first, divide by the right count, and check for outliers before you choose. When one extreme value is present, the median usually tells the truest story.
With the same five numbers, you saw all three methods give different answers (6, 5, and 5), and you saw one outlier push the mean from 6 to 14 while the median stayed put. Use that comparison whenever you are unsure which measure to pick.

Mikha Piregu is a Content Writer with experience spanning educational content, including math and math olympiad topics, as well as advocacy writing, research-based articles, and SEO-driven web content. He creates high-quality blog content, web copy, and feature articles that support brand visibility, audience engagement, and long-term organic growth through data-informed storytelling. Skilled in WordPress, WooCommerce, and modern digital tools, Mikha adapts content across various platforms, including blogs, websites, campaigns, and advocacy initiatives, with clarity and purpose.


There are no comments posted here yet.
Sign in to leave a comment